The pie chart given here shows the spending by a family on various items during the year 2000. Standy the graph and answer these questions.
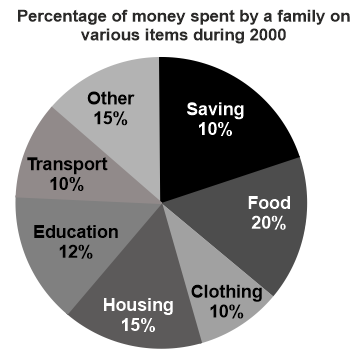
The ratio of the total amount of money spent on housing to that spent on education was:
Show answer & explanation
Correct answer: B
Explanation
The correct answer is option 2 i.e. 5:4.
Housing : Education = 15 : 12 = 5 : 4
Therefore, the ratio of the total amount spent on housing to that spent on education is 5 : 4.