The pie chart given below shows the production of wheat by 5 factories. The data is presented in the terms of percent.
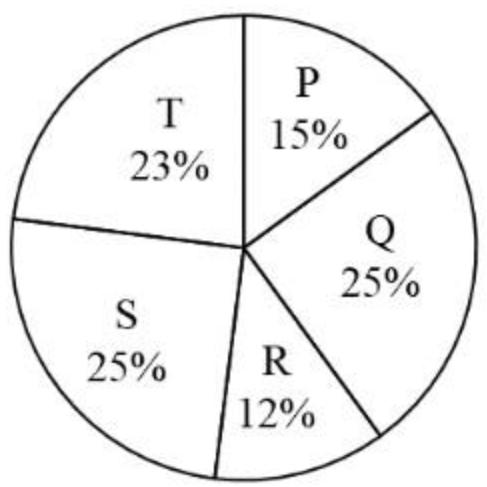
What is the ratio of production of wheat by P to the total production of wheat by Q and S?
Show answer & explanation
Correct answer: B
Explanation
Given:
P = 15%, Q = 25%, S = 25%
According to the formula:
Ratio = Ratio of the corresponding values
P : (Q + S) = 15 : (25 + 25)
= 15 : 50
= 3 : 10