The pie chart given below shows the production of 5 mobile brands. The data is presented in the terms of percent.
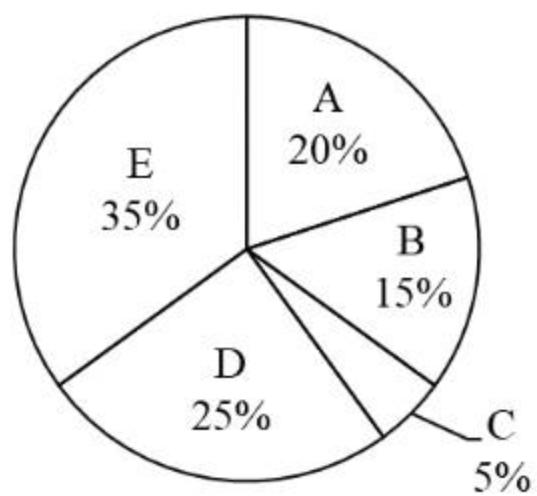
What is the ratio of total production of A and B to the total production of D and E?
Show answer & explanation
Correct answer: A
Explanation
Given:
A = 20%
B = 15%
C = 5%
D = 25%
E = 35%
Production of A + B = 20% + 15% = 35%
Production of D + E = 25% + 35% = 60%
Ratio = (A + B) : (D + E) = 35 : 60 = 7 : 12