The given graph shows the production of food grains of a country in different years. Study the graph and answer the question that follows.
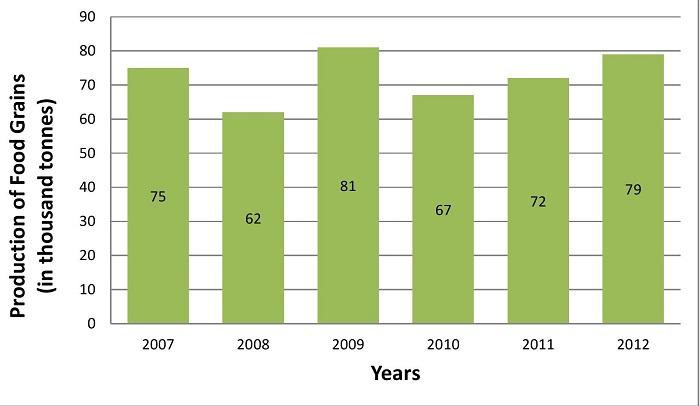
The percentage increase in production from 2010 to 2011 was (Rounded off to 2 decimal places):
Show answer & explanation
Correct answer: B
Explanation
The correct answer is option 2 i.e 7.46%.
The production in 2010 = 67
The production in 2011 = 72
The increase in production from 2010 to 2011= 72 - 67 = 5
The percent increase in production from 2010 to 2011 = 5/67 × 100 = 7.46%