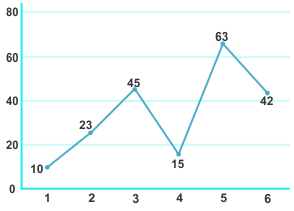
The line graph shows the scores of a batsman in 6 consecutive matches. What is the range of his scores?
Show answer & explanation
Correct answer: A
Explanation
The correct answer is option 1 i.e. 53
Range = (Maximum value - minimum value) of data
Maximum value = 63
Minimum value = 10
Range = 63 - 10 = 53