The line chart given below shows the ratio of imports to exports for a country for 5 consecutive years Y1, Y2, Y3, Y4 and Y5.
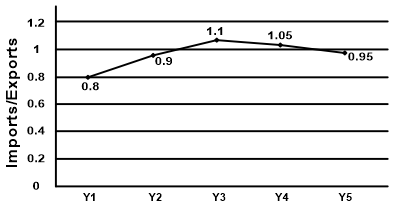
Which of the following statement is true?
Show answer & explanation
Correct answer: C
Explanation
The correct answer is option 3 i.e. Data is Insufficient.
Here we cannot calculate the exact import and export so we cannot find out the least and maximum exports and imports in terms of number so answer is option 3 i.e. Data is Insufficient.