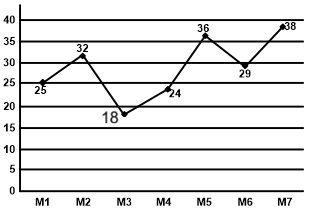
The line chart given below shows the production (in 10000s) of cars in 7 different months.
What is the average monthly production for the given 7 months?
Show answer & explanation
Correct answer: D
Explanation
The correct answer is option 4 i.e. 28.8 (in 10000s).
| Understanding/Application |
| Total monthly production for the given 7 months (in 10000s) = 25 + 32 + 18 + 24 + 36 + 29 + 38 = 202 |
| Required average = 202/7 = 28.8 |