The graph shows the data of the number of accidents by three types of vehicles: X, Y and Z in four cities: P, Q, R and S.
Study the given graph and answer the question that follows.
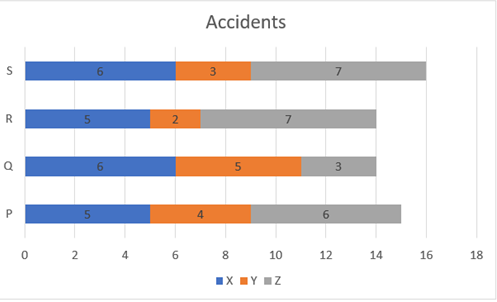
The correct increasing order of the cities as per the total number of accidents by all types of vehicles is:
Study the given graph and answer the question that follows.
The correct increasing order of the cities as per the total number of accidents by all types of vehicles is:
Show answer & explanation
Correct answer: A
Explanation
The Solutions will be uploaded soon