The given table shows the number (in thousands) of cars five different models A,B,C,D and E produced during years 2012-2017. Study the table and answer the question that follow.
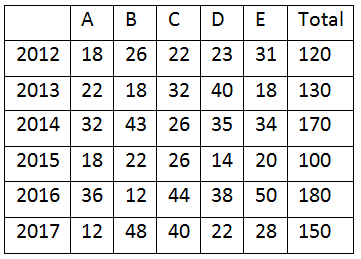
The percentage increase in the total cars in 2016 over 2012, is:
Show answer & explanation
Correct answer: B
Explanation
The correct answer is Option 2 i.e. 50%
| Understanding | Application |
| Tricks |
Total in 2012 = 120 Total in 2016 = 180 |
| Now |
if 120 = 100% then 180 = 100/120 × 180 = 150% |
| Hence | increment = 50% |