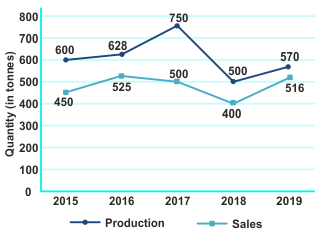
The given line graph shows the production (in tonnes) and the sales (in tonnes) of a company.
What is the percentage of maximum increase or reduction in the production of the company in comparison to the previous year?
Show answer & explanation
Correct answer: A
Explanation
The correct answer is option 1 i.e. 33.33% reduction.
The percentage change in the production from 2015 to 2016 = (628 - 600)/600 × 100% = 4.67%
The percentage change in the production from 2016 to 2017 = (750 - 628)/628 × 100% = 19.42%
The percentage change in the production from 2017 to 2018 = (750 - 500)/750 × 100% = 33.33%
The percentage change in the production from 2018 to 2019 = (570 - 500)/500 × 100% = 14%