The given histogram shows the frequency distribution of the speed of cars passing though at a particular spot on a highway. Study the graph and answer the question that follows.
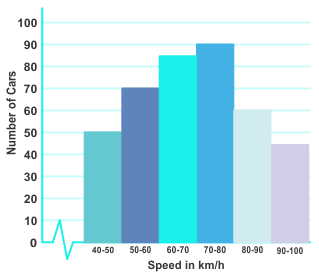
What percenatge of cars were running with speed less than 70 km/h ?
Show answer & explanation
Correct answer: A
Explanation
The correct answer is option 1 i.e. 51.25%
Total number of cars = 50 + 70 + 85 + 90 + 60 + 45 =400
The total numbers of cars were running with speed less than 70 km/h = 50 + 70 + 85 = 205
The required percenatge = (205/400) × 100 = 51.25%