The given histogram represents the marks of students in the Mathematics test of a certain class.
The total number of students is 350.
Study the graph and answer the question that follows
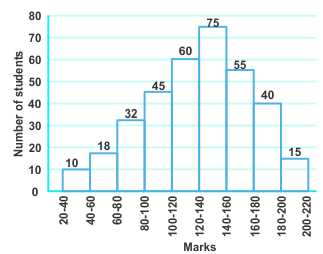
What is the ratio of the total number of students who scored 140 marks and above to the total number of students who scored marks between 60 to 120?
Show answer & explanation
Correct answer: C
Explanation
The correct answer is option 3 i.e. 110 : 137
Number of students who obtained 140 or above marks = 55 + 40 +15 = 110
Number of students who obtained 60 to 120 marks = 45 + 60 + 32 = 137
Required Ratio = 110 : 137