The given graph shows the production of food grains by a state (in 1000 tons) over the years from 1989 to 1996. Study the graph carefully and answer the question that follows.
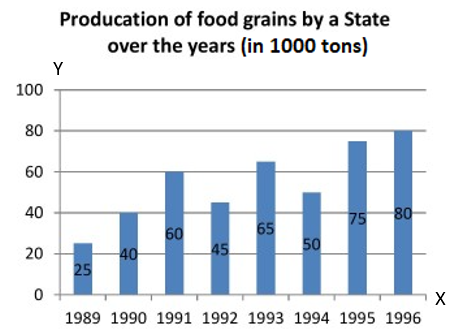
In how many of the given years was the production of food grains more than the average production of the given years?
In how many of the given years was the production of food grains more than the average production of the given years?
Show answer & explanation
Correct answer: D
Explanation
The Solutions will be uploaded soon