the given graph shows the number ( in hundreds) of trees axed in four cities during the period 2016 - 2020 ?
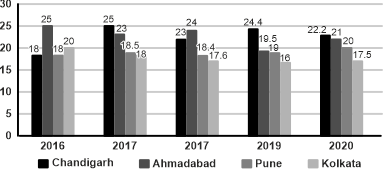
Find the average number of trees axed from all the four cities in 2019 (neglect the decimal party)
Show answer & explanation
Correct answer: D
Explanation
The correct answer is option 4 i.e. 1972.
Average number of trees axed from all the four cities in 2019 = (2440 + 1950 + 1900 + 1600)/4
= 7890/4
= 1972.5
= 1972 (Neglected the decimal)