The given graph shows the income and expenditure of a family. Study the graph and answer the question that follows.
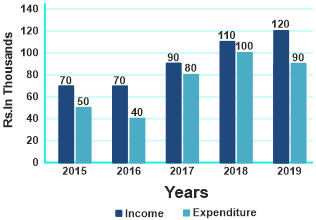
The expenditure of the family increased by _____ from 2017 to 2018.
Show answer & explanation
Correct answer: A
Explanation
The correct answer is Option 1 i.e. 25%.
Expenditure of family in 2017 = 80
Expenditure of family in 2018 = 100
Percentage increase = 20/80 × 100 = 25%