The given circle graph shows the spending of a country on various sports during a year. study the graph carefully and the question that follows.
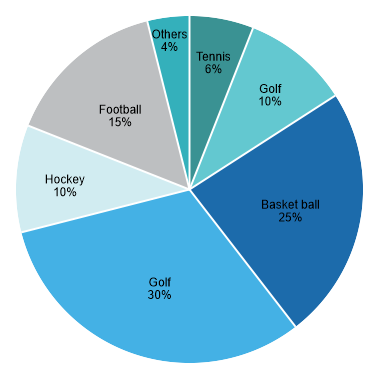
the country spent the same amount of money on:
Show answer & explanation
Correct answer: D
Explanation
The correct answer is option 4 i.e. Hockey and Golf
We can see from the pie chart that the amount of money spent on Hockey and Golf both is 10% of the total amount spent by the country.