The given chart represents the sales of automobiles in India (by type, in million units) from the year 2011 to 2014. Study the chart and answer the question that follows.
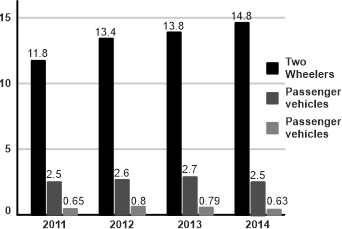
The percentage increase in the sales in 2013 over the previous year was the maximum for which of the categories of vehicles?
Show answer & explanation
Correct answer: C
Explanation
The correct answer is option 3 i.e. Passenger vehicles.
Two-wheelers = [(13.8 - 13.4)/13.4] × 100 = (0.4/13.4) × 100 = 2.99%
Passenger vehicles = [(2.7 - 2.6)/2.6] × 100 = (0.1/2.6) × 100 = 3.85%
Commercial vehicles = Sales decreased in 2013 from 2012
Therefore, the maximum percentage increase in sales in 2013 was for Passenger vehicles.