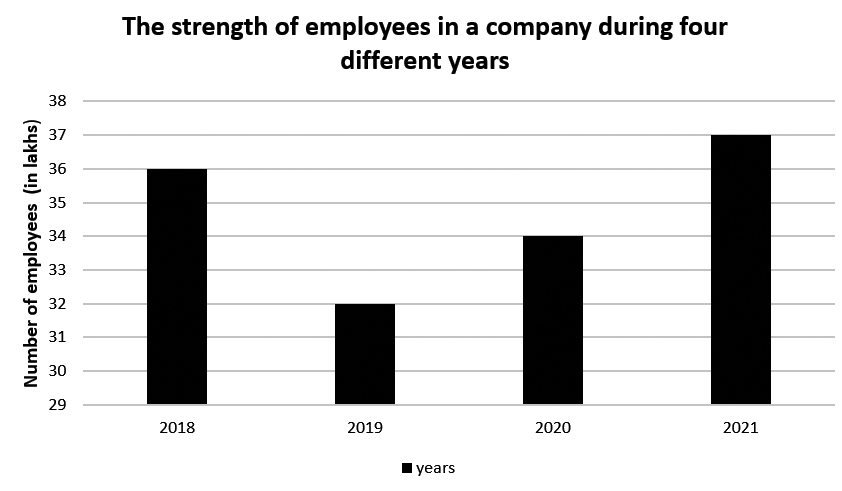
The given bar graph shows the strength of employees (in lakhs) of a company during four different years.
What was the percentage increase in employees in 2020 over 2019?
Show answer & explanation
Correct answer: A
Explanation
The correct answer is option 1 i.e. %.
According to the given graph,
Strength of employees in 2019 = 32 L
Strength of employees in 2020 = 34 L
Change in the strength of employees from 2019 to 2020 = 34 - 32
⇒ 2 L
Percentage increase =
⇒ %
Hence the percentage increase in employees in 2020 over 2019 is %.