The given bar graph shows the sales of computers from six dealers A, B, C, D, E, and F, during two consecutive years 2015 and 2016. Study the graph and answer the question that follows.
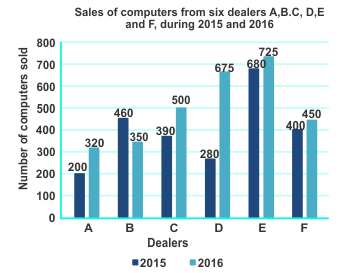
What is the ratio of the total sales from dealers A, B and C taken together for the year 2015 to the sales from dealers. D, E and F taken together for the year 2016?
Show answer & explanation
Correct answer: C
Explanation
The correct answer is option 3 i.e. 21 : 37
Sale of computer from dealer A, B, and C in the year 2015 = 200 + 460 + 390 = 1050
Sale of computer from dealer D, E, and F in the year 2016 = 675 + 725 + 450 = 1850
Ratio = 1050/1850 = 21 : 37