The given bar graph shows the production of onions (in quintals) from the year 2018 to 2022. Study the graph and answer the question that follows.
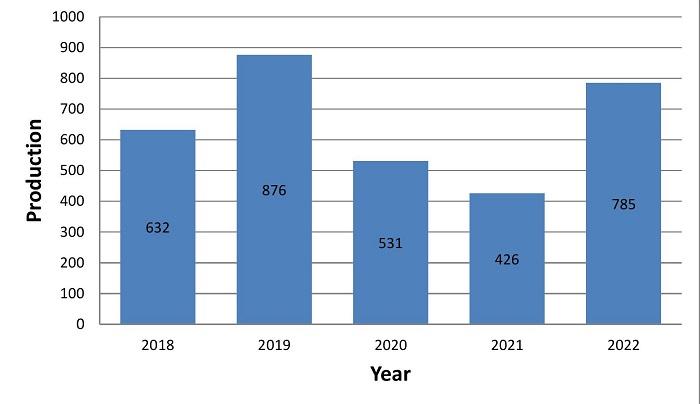
Considering the average production during this period, the number of years in which the production is above the average is:
Show answer & explanation
Correct answer: B
Explanation
The correct answer is option 2 i.e. 2.
Average of 2018 to 2022 = (632 + 876 + 531 + 426 + 785)/5 = 650
Hence
According to the question.
The number of years in which the production is above the average = 2