The given bar graph shows the number of students enrolled in Institutes A and B during 5 years (2014 to 2018).
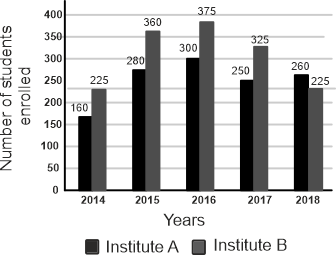
What is the ratio of the total number of students enrolled in both the institutes during 2017 and 2018 to that of the number of students enrolled in institute B for the year 2016?
Show answer & explanation
Correct answer: A
Explanation
The correct answer is Option 1 i.e. 212 : 75.
Total students enrolled in Institute during 2017 and 2018 = 250 + 325 + 260 + 225 = 1060
Students enrolled in Institute B in the year 2016 = 375
Ratio = 1060 : 375 = 212 : 75
The ratio is 212 : 75.