The given bar graph shows the number of accidents in a city during the first 6 months of a year. Examine the bar graph and answer the question.
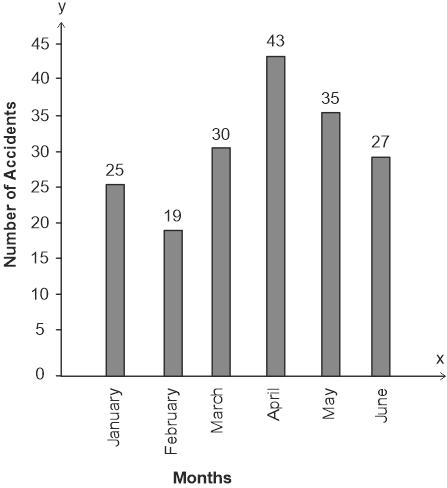
What is the percentage of accidents in the month of April with respect to the total accidents in the city during six months? (Correct to nearest integer)
Show answer & explanation
Correct answer: B
Explanation
The correct answer is option 2 i.e. 24%.
According to the given graph,
Total number of accidents in the city in all the six months together = 25 + 19 + 30 + 43 + 35 + 27 = 179
Number of accidents in the city ion month of april = 43
Required percentage = = 24.022 ≈ 24%