The given bar graph shows the number of students enrolled in institutes A and B during 5 years (2014 to 2018).
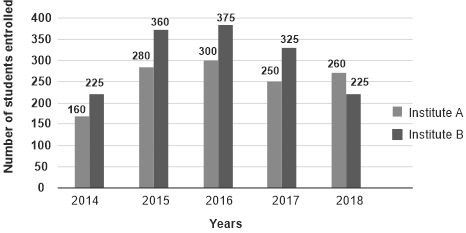
What is the ratio of the average number of Students enrolled in institute B to the average number of students enrolled in institute A during these years?
Show answer & explanation
Correct answer: D
Explanation
The correct answer is option 4 i.e. 151 : 125.
Avergae of number of students in institute B = (225 + 360 + 375 + 325 + 225)/5
⇒ 1510/5
Avergae of number of students in institute A = (160 + 280 + 300 +250 + 260)/5
⇒ 1250/5
Required ratio = 1510/5 : 1250/5
⇒ 1510 : 1250 = 151 : 125