The given bar graph shows the income and expenditure (in crores Rs) of a company over 5 years, from 2014 to 2018.Study the bar graph and answer the question that follows.
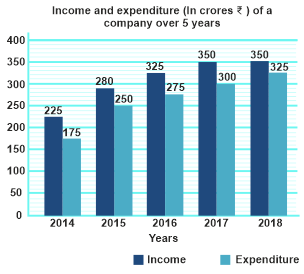
In which of the following years is the ratio of income to expenditure the minimum?
Show answer & explanation
Correct answer: B
Explanation
The correct answer is option 2 i.e. 2018
Calculations:
Ratio of income to expenditure in 2014 = 225/175 = 1.29
Ratio of income to expenditure in 2015 = 280/250 = 1.12
Ratio of income to expenditure in 2016 = 325/175 = 1.18
Ratio of income to expenditure in 2017 = 350/300 = 1.16
Ratio of income to expenditure in 2018 = 350/325 = 1.08
Hence, the ratio of income to expenditure the minimum in 2018.