The given bar graph shows the imports and exports (in crores) of steel by a country from 2013 to 2017.
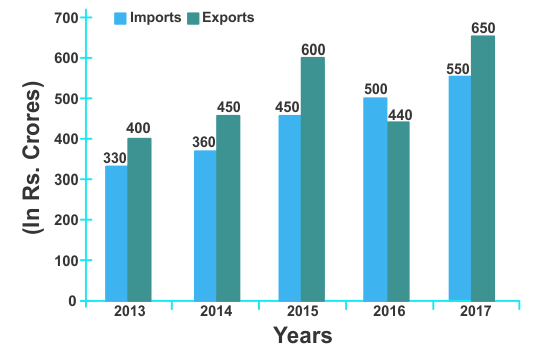
What is the ratio of the total imports in 2015 and 2017 to the total exports in 2013 and 2016 ?
Show answer & explanation
Correct answer: C
Explanation
The correct answer option is 3 ie 25 : 21.
I15 + 17 = E13 + 16
1000 = 840
25 : 21