The given bar graph shows the imports and exports (in crores) of steel by a country from 2013 to 2017.
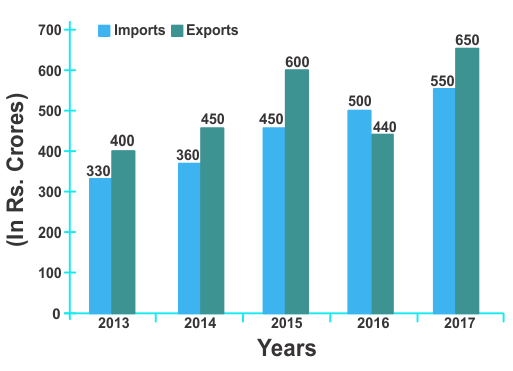
In how many years were the imports more than 80% of the average exports (per year) of the country during the given 5 years ?
Show answer & explanation
Correct answer: D
Explanation
The correct answer is option 4 ie 3.
Average export = 2540 / 5 = 508
(80 / 100) × 508 = 406.4
Total number of years = 3