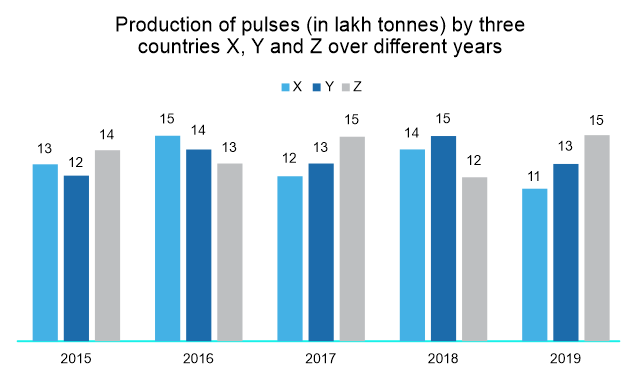
The given bar-graph shows the data of production of pulses (in lakh tonnes) by three different countries X, Y and Z over the years. Study the bar graph and answer the question that follows.
For which country is the average production (in lakh tonnes) for five years the maximum?
Show answer & explanation
Correct answer: B
Explanation
The correct answer is option 2 i.e. Z
Calculations:
Average production of country X = (13 + 15 + 12 + 14 + 11)/5 = 65/5 = 13
Average production of country Y = (12 + 14 + 13 + 15 + 13)/5 = 67/5 = 13.4
Average production of country Z = (14 + 13 + 15 + 12 + 15)/5 = 69/5 = 13.8
Hence, average production (in lakh tonnes) for five years is the maximum in country Z.