The given bar graph shows the biscuit exports of India over a period of five years. Study the graph and answer the question that follow.
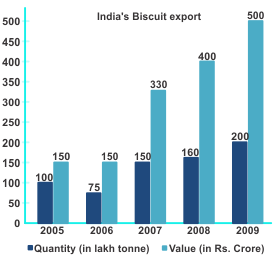
What was the percentage drop in the export quantity from 2005 to 2006?
Show answer & explanation
Correct answer: D
Explanation
The correct answer is option 4 i.e 25%
The export quantity in 2005 = 100 lakhs tonne
The export quantity in 2006 = 75 lakhs tonne
The percentage drop = (75 - 100) / 100
⇒ 25% decline