The given bar graph shows exports of cars of type A and B (in Rs millions) from 2014 to 2018. Study the graph and answer the question that follows.
Study the graph and answer the question that follows.
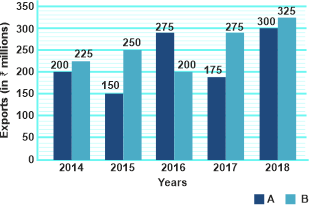
What is the ratio of the total exports of cars of type A in 2014 and 2018 to the total exports of cars of type B in 2015 and 2017?
Show answer & explanation
Correct answer: B
Explanation
The correct answer is option 2 i.e. 20 : 21.
Total export of car A in 2014 and 2018 = 500 million
Total export of car B in 2015 and 2017 = 525 million
Thus, the required ratio = 20 : 21