The given bar graph represents the production and sales of a certain crop in quintals by the farmers F1, F2, F3 and F4.
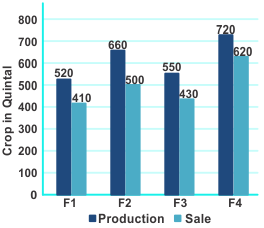
What is the ratio between the total sales and total production by all farmers?
Show answer & explanation
Correct answer: A
Explanation
The correct answer is Option 1 i.e. 4: 5.
| Understanding/Application |
|
Total production of all farmers = 520 + 660 + 550 + 720 = 2450 Total sales of all farmers = 410 + 500 + 430 + 620 = 1960 |
|
Thus, the required ratio = 1960: 2450 = 4: 5 |