The given bar graph represents the pass percentage of 10th and 12th classes of a school during the consecutive four year period 2016-2019.
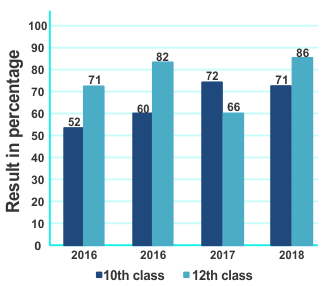
What is the average percentage of the failed students of the 12th class for all four years?
Show answer & explanation
Correct answer: C
Explanation
The correct answer is option 3 i.e 23.75%
|
Understanding Tricks |
|
Application Total failed students in 12th = 14 + 34 + 18 + 29 = 95 |
|
Now Average = 95/4 = 23.75 |