The given bar graph represents the number of students admitted in four schools (S1, S2, S3, S4) during two consecutive years 2017 and 2018.
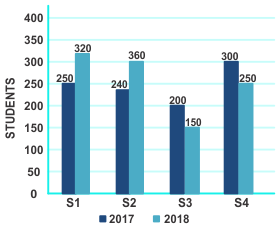
What is the average number of students admitted to all schools in 2018?
Show answer & explanation
Correct answer: C
Explanation
The correct aswer is option 3 i.e 270
|
Understanding Tricks |
|
Application The sum of all students in 2018 = 320 + 360 + 150 + 250 = 1080 |
|
Now Average = 1080/4 = 270 |