The given bar-graph represents the number of teachers in different weight groups. Study the graph and answer the question that follows.
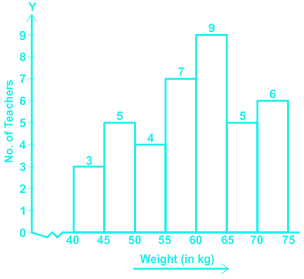
In which of the following weight groups is the number of teachers the maximum?
Show answer & explanation
Correct answer: B
Explanation
The correct answer is option 2 i.e 60 – 65
By looking at the graph we can see that the height of the bar is maximum in between 60-65, the maximum number of teachers would be in 60-65 age group.