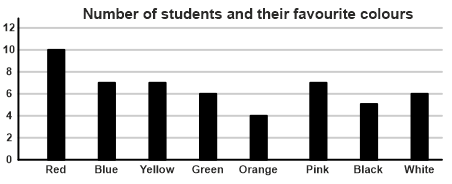
The given bar graph reflects the data on the favourite colours of several students in a class. Suppose the students are divided into two groups, A and B, with those in Group A choosing one of Red, Green, Orange or Pink as the favourite colour and those in Group B choosing any of the other four colours as the favourite. How many more students were there in Group A than in Group B, as per the bar graph?
Show answer & explanation
Correct answer: A
Explanation
The correct answer is Option 1 i.e. 2.
Number of students in Group A who chose Red, Green, Orange, or Pink = 10 + 6 + 4 + 7 = 27
Number of students in Group B who chose Blue, Yellow, Black, or White = 7 + 7 + 5 + 6 = 25
Difference = 27 - 25 = 2