The given bar chart shows the production of fertilizers by a company (in 1000 tonnes) over 6 years (from 2010 to 2015). Study the bar chart and answer the question that follows.
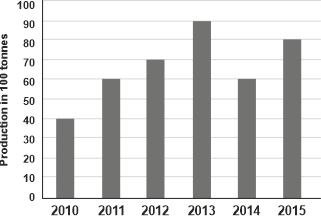
In which of the following years was the percentage increase in production as compared to the previous year the minimum?
Show answer & explanation
Correct answer: C
Explanation
The correct answer is option 3 i.e. 2012.
% increase year by year:
2011: × 100 = 50%
2012: × 100 = 16.67%
2013: × 100 = 28.57%
2014: decrease
2015: × 100 = 23.08%
Minimum % increase = 16.67% in 2012