m
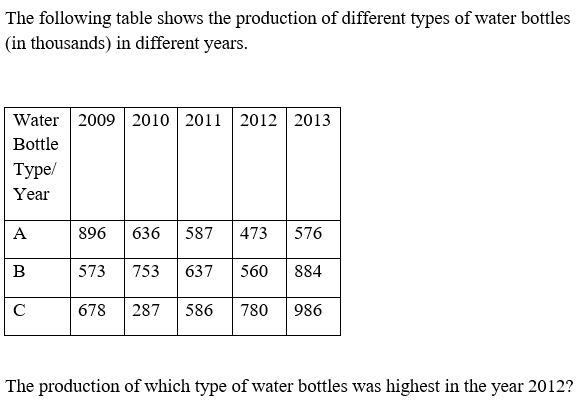
The following table shows the production of different types of water bottles (in thousands) in different years
| Water Bottle Type/Year |
2009 | 2010 | 2011 | 2012 | 2013 |
|---|---|---|---|---|---|
| A | 896 | 636 | 587 | 473 | 576 |
| B | 573 | 753 | 637 | 560 | 884 |
| C | 678 | 287 | 586 | 780 | 986 |
Show answer & explanation
Correct answer: B
Explanation
The correct answer is option 2 i.e C.
According to the table,
The producation of water bottles was highest in the year 2012 = C