The following pie charts represent the distribution of candidates who were enrolled for an entrance examination and the candidates (out of those enrolled) who passed the examination in different institutes (P, Q, R, S, T, V,X).
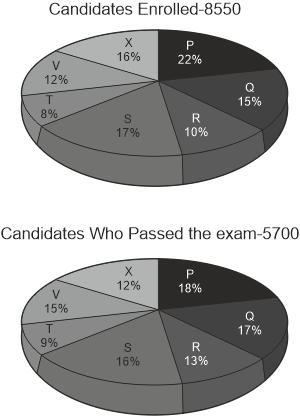
The mumber of candidates who passed from institutes P and Q together exceeds the mumber of candidates who enrolled from institutes T and R together by:
Show answer & explanation
Correct answer: D
Explanation
The correct answer is option 4 i.e. 456.
P + Q = 35%
100% = 5700
35% = 1995
T + R = 18%
100% = 8550
18% = 1539
difference = 1995 - 1539 = 456