The following pie chart represents the data of movies released in a city throughout the year.
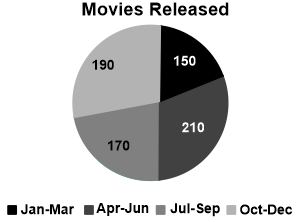
The combined angle made by Jan-Mar and Jul-Sep is ____________ than the combined angle made by Apr-Jun and Oct-Dec.
Show answer & explanation
Correct answer: D
Explanation
The correct answer is option 4 i.e. 40° less.
Total movies release = 150 + 210 + 170 + 190 = 720
Angle made by the pie chart = 360°
So, 360° = 720
The combined angle made by Jan-Mar and Jul-Sep = 150 + 170 = 320
The combined angle made by Apr-Jun and Oct-Dec = 210 + 190 = 400
⇒ 400 - 320 = 80
⇒ 1° = 2
So, 80 = 80/2 = 40°
The combined angle made by Jan-Mar and Jul-Sep is 40° less than the combined angle made by Apr-Jun and Oct-Dec.