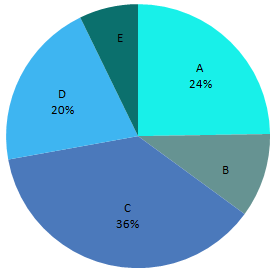
The following pie-chart and table show the percentage distribution of farmers in 5 states A, B, C, D & E of a country who claimed insurance due to drought in the year 2017 and ratio of males to females of the number of farmers in states, respectively. Study the pie-chart and the table carefully and answer the following questions. Note: Some data are missing in the pie-chart and table, if required in any question, find the missing data first and then answer the question. Total number of farmers who claimed insurance in the year 2017 = 2,64,000
|
Sates |
Ratio of Male to Female in the farmers who claimed insurance in 2007 |
|
Male : Female |
|
|
A |
05 : 03 |
|
B |
04 : 01 |
|
C |
----- |
|
D |
5 : --- |
|
E |
03 : 02 |
The number of farmers who claimed insurance in state C exceeds the total number of farmers (who claimed insurance)in state E and state A together by 5280. What is the percentage of farmers who claimed insurance in state E?
Show answer & explanation
Correct answer: C
Explanation
The correct answer is Option 3 i.e. 10%
|
Understanding |
Application |
|
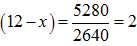
Let x% farmers claimed insurance in state E |
x = 12 – 2 x = 10% |