The following line graph shows the ratio of imports to exports of two companies over the years. Study the graph carefully and answer the question that follows.
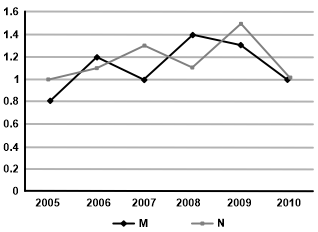
The exports of Company M with relation to imports was the maximum in which of the following years?
Show answer & explanation
Correct answer: A
Explanation
The correct answer is option 1 i.e. 2005.
Given,
The ratio of imports to exports
Now,
Just find the reciprocal of the given ratio;
⇒ 2005: 1/0.8 = 1.25
⇒ 2006: 1/1.2 = 0.833
⇒ 2007: 1/1 = 1
⇒ 2008: 1/1.4 = 0.71
⇒ 2009: 1/1.25 = 0.8
Hence, exports of Company M with relation to imports was the maximum in 2005.