The following graph shows the sales of cars (in thousands) in four cities in 4 years. Study the graph and answer the question.
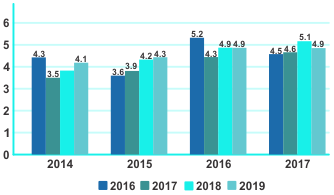
| 2016 | 2017 | 2018 | 2019 | |
| City-1 | 4.3 | 3.5 | 3.9 | 4.1 |
| City-2 | 3.6 | 3.9 | 4.2 | 4.3 |
| City-3 | 5.2 | 4.3 | 4.9 | 4.9 |
| City-4 | 4.5 | 4.6 | 5.1 | 4.9 |
Which city has the highest percentage of sales, and in which year?
Show answer & explanation
Correct answer: A
Explanation
The correct answer is option 1 i.e City-3; 2016
Here we will end up verifying 16 options by conventional technique but there are no options like; None of these/Others so we can verify the four given options to find the best answer.
Option 1: 5.2 / 19.3 = 27%
Option 2: 4.1 / 15.8 = 26%
Option 3: 4.6 / 19.1 = 24%
Option 4: 4.2 / 16.0 = 26%
Option 1 has the highest percentage of sales.