The following graph shows the sale of few items of a garment company for three months.
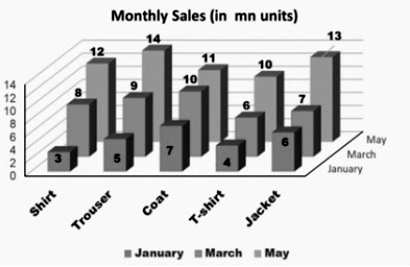
What is the percentage of the sale of the least selling item in the three months over the total sale of the company?
Show answer & explanation
Correct answer: A
Explanation
The correct answer is option 1 i.e. 16%.
From the graph:
| Jan | March | May | Total | |
| Shirt | 3 | 8 | 12 | 23 |
| Trouser | 5 | 9 | 14 | 28 |
| Coat | 7 | 10 | 11 | 28 |
| T-shirt | 4 | 6 | 10 | 20 (Least) |
| Jacket | 6 | 7 | 13 | 26 |
Total sales of the company = 23 + 28 + 28 + 20 + 26 = 125
Least selling item i.e. T-shirt = 20
Required percentage = (20/125) × 100 = 16%