The following graph shows the production of paddy in the agricultural land available in the 6 places S1, S2, S3, S4, S5, S6 (area in hundreds of hectares and production in thousands of tones)
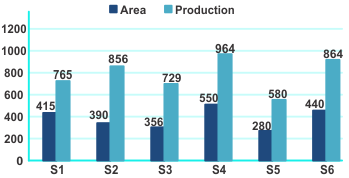
Based on the information, the production ratio (production to land) is highest and lowest, respectively, in:
Show answer & explanation
Correct answer: A
Explanation
The correct answer is option 1 i.e S2, S4
| Understanding | Application |
| We need to compare ratios of different bases to find out the maximum and minimum among them. |
We need to find the ratio of production and land in every S. By merely looking at numbers we can say that ratio of S1 & S4 is less than 2, the rest are not. Now, by comparing S1 & S4 we would get that S4 would be lower, so Option 1 is right |