The following graph shows the income and expenditure of a company. Study the graph carefully and answer the question based on the graph.
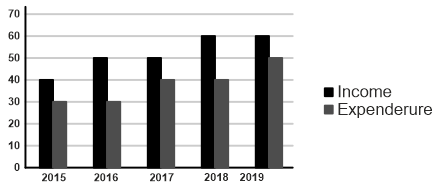
The difference between the profits in 2015 and 2016 is:
Show answer & explanation
Correct answer: A
Explanation
The correct answer is option 1 i.e. Rs.10 lacs
Here, we have in the year 2015
Income in 2015 = 40 lac
Expenditure in 2015 = 30 lac
⇒ Profit = Income - Expenditure = (40 - 30) = 10 lac
Now, in the year 2016
Income in 2016 = 50 lac
Expenditure in 2016 = 30 lac
Profit = (Income - Expenditure) = (50 - 30) = 20 lac
So, Difference in Profits in both the year = (20 - 10) = 10 lac.