The following graph shows the data of the collection of interest on loans (in crore Rs.) by six branches B1, B2, B3, B4, B5 and B6 of a bank during the years mentioned.
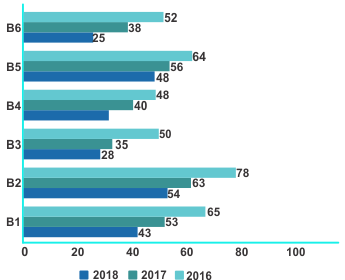
Based on the information, from the year 2016 to 2017, the highest rate of collection is for the branch:
Show answer & explanation
Correct answer: D
Explanation
The correct answer is option 4 i.e B6.
| Understanding | Application | |||||||||||||||||||||||||||||||||||
|
To check performance we need to find the percentage increment from the year 2016 to 2017. Rate of change = (Difference/Intial value) x 100 |
So, the highest rate of collection is for branch B6. |