The following graph represents the production of electric scooters (in thousands) for the years 2020 and 2021 from five manufacturers P, Q, R, S, and T.
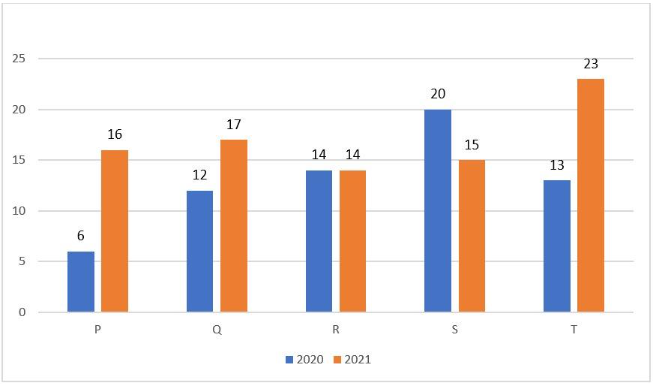
What is the percentage by which the total production of all manufacturers in the year 2021 exceeds the total production of manufacturers in the year 2020? (Round to the nearest integer)
What is the percentage by which the total production of all manufacturers in the year 2021 exceeds the total production of manufacturers in the year 2020? (Round to the nearest integer)
Show answer & explanation
Correct answer: D
Explanation
The Solutions will be uploaded soon