The following chart shows the share (percentage wise) of total number of computers sold by dealers A and B together during 5 months. Study the chart and answer the given question.
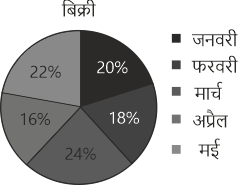
Total number of computers sold by dealers A and B in March = 576
The ratio of computers sold by dealers A and B in February is 6 : 5. The difference between the number of computers sold by A and B is x. The value of x will be between_______
Show answer & explanation
Correct answer: C
Explanation
The correct answer is Option 3 i.e. 35 and 40.
24% = 576
1% = 24
The ratio of computers sold by dealers A and B in February is 6 : 5
Difference = = 39.27
39.27 lie between 35 and 40.