The following bar graph shows the sales of a company (in₹ crore) in different years. Study the graph and answer the question.
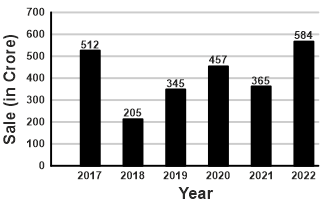
The mean of the highest and lowest sales (in₹ crore) is:
Show answer & explanation
Correct answer: B
Explanation
The correct answer is option 2 i.e. 394.5.
Total sale (in₹ crore) in 2022 = 584 (Highest)
Total sale (in₹ crore) in 2018 = 205 (Lowest)
Mean (in₹ crore) of 2018 and 2022 = (584 + 205)/2 = 789/2 = 394.5
Therefore, the mean of the highest and lowest sales (in₹ crore) is 394.5.