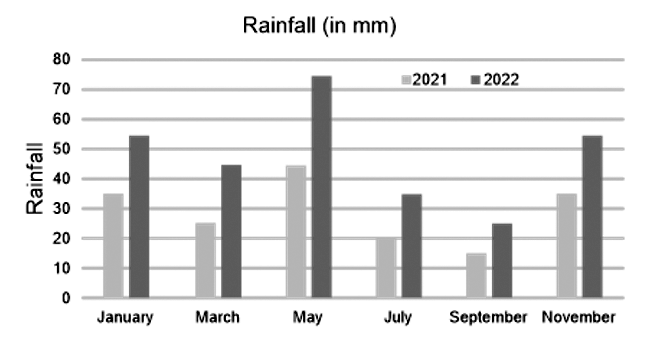
The following bar graph shows the rainfall over two years. Which of the following months shows the highest percentage change in rainfall?
Show answer & explanation
Correct answer: D
Explanation
The correct answer is Option 4 i.e. March.
Percentage change in January = (55 - 35)/35 × 100 = 57.14%
Percentage change in March = (45 - 25)/25 × 100 = 80%
Percentage change in May = (75 - 45)/75 × 100 = 40%
Percentage change in July = (35 - 20)/35 × 100 = 42.85%
Percentage change in September = (25 - 15)/25 × 100 = 40%
Percentage change in November = (55 - 35)/35 × 100 = 57.14%
Thus, the height percentage changed in rainfall in March.