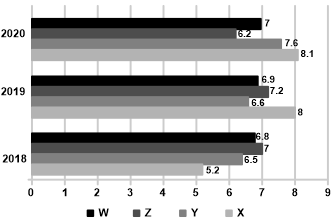
The following bar graph shows the production of cement (in 10,000 tons) by 4 companies, X, Y, Z, and W, during the period 2018 - 2020. Study the bar graph carefully and answer the question.
Which company has the maximum average production over the course of 3 years?
Show answer & explanation
Correct answer: B
Explanation
The correct answer is Option 2 i.e. X.
Average production of company X = = 7.1
Average production of company Y = = 6.9
Average production of company Z = = 6.8
Average production of company W = = 6.9
Thus, company X has the maximum average production